- Original-Veröffentlichung
- Voherige Episode S01E14 - Six months later: comparing Shane and Jenna's…
- Episode S01E15
-
Externe Links
YouTube Beschreibung
-
Letzte Aktualisierung
24 juillet 2023 - 11:48
auf 11 Datenbanken
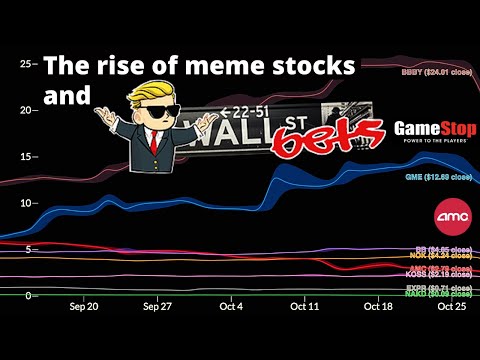
Watch $GME, $AMC and other "meme stock" prices rise
Given the current brawl between Reddit and Wall Street, I wanted to make an animated timeline of the "meme stock" share prices at the center of it, and also of various trading subreddits' growth.
For the first graph, I collected data for Gamestop (GME), Express (EXPR), Blackberry (BB), AMC, Bed Bath and Beyond (BBBY), Naked (NAKD), Nokia (NOK) and KOSS. For the second, I collected data for r/WallStreetBets, r/Stocks, r/WallStreetBetsELITE, r/WallStreetBetsNew and r/SatoshiStreetBets.
0:00 Closing share prices
2:12 Subreddit growth
Follow me on twitter! https://twitter.com/vastava_
Other videos you might enjoy:
2020 Rewind! Wikipedia's most viewed articles, by day (July 2020 - Jan 2021) https://www.youtube.com/watch?v=XP0Xft-MNqs
Timeline of COVID-19 deaths by country (and Trump's comments on the virus) https://www.youtube.com/watch?v=MjWYktUThmA
#vastava #gamestop #wallstreetbets